Showing posts with label AUDUSD. Show all posts

Tuesday, 23 July 2013

AUDUSD – CORRECTION OR CONSOLIDATION?

As long-time readers know, I only occasionally comment on markets, with most of my other commentary saving itself more generally for aspects of trader performance, psychology and behaviour. One of my favourite markets to comment on (and trade) is AUDUSD fx. Maybe its because I have a good record on this in recent year, though whether that is skill or luck who knows?

My first attempt at calling the AUDUSD this year was Back in February. Whilst my call proved correct, my timing was a little premature. Nonetheless, I did qualify this in the title of the post ‘Is the AUDUSD in the early stages of turning?’ Approximately 2 months later it finally turned.

My next attempt was to call a bottom for the strong down-move from April through to late June. The post on the 25th June was titled ‘AUDUSD FX SPOT - Possible pause in the downside as market hits key Fibo levels.’. Whilst the call has proved prescient, the market did move slightly lower than I suggested it might, though in truth this was short-lived and quite marginal.

Over the 2 calls, I’d give myself a mark of around ‘8 out of 10’. – I did I’m glad to say have the trade on too, though I took my profit a little early, but still managed to catch a nice move.

Where to next then? My favoured call is that we are in the early stages of a correction, though this is not a high confidence call at this stage, and it is quite possible that the market is consolidating ahead of further decline. Looking at the attached 8 hour chart below, what appears to be a rounded basing pattern may have formed, though until it clears 9280 and then 9326 on decent volume and manages to hold those levels there is a risk of failure in the basing call. Looking at where the correction may move to if it does unfold. I’m guessing gains could move to around 9580 to 9600. This is where the 2012 low and the level where 38% correction of the drop from April occurs. A sustained move through 96.00 could possibly push higher closer to 98.00. – Personally I still remain bearish longer-term, hence any rally is most likely a contra-trend move, with the low to mid 80s still on the cards for later 2013 or 2014.

Looking at the risk reward on this trade, if it were to prove correct, then we could be looking at approximately 300-350 points on the upside (And possibly more), with risk below last week’s 9137 low, therefore approximately 110 points risk at this time. I like this risk/reward on this trade, though dip buyers would naturally improve their odds. Waiting for a confirmed break, would bring greater confidence to the trade, however it would have a far inferior risk/rewards odds in my mind.

Anyway, third time luck for this year, let’s see what the summer holds. (Or winter if you reading this south of the equator).


Tuesday, 25 June 2013

AUDUSD FX SPOT - Possible pause in the downside as market hits key Fibo levels.


Amongst my musings about trading and market psychology I occasionally comment on some aspect of the market or a particular market. One of my favourites markets, which I have commented on a couple of times over the past couple of years, has been AUDUSD. My most recent comment was from the 6th Feb and was titled ‘Is the AUDUSD in the early stages of turning?’. 

I probably don’t need to elaborate on events of the past two months, unless of course you have been on holed-up in an Ashram half way up the Himalayas. – Whilst my big picture view still favours further correction on the AUDUSD, probably to somewhere in the low 80s at some point later this year or perhaps next, in the meantime, I feel that the market has done an awful lot of damage in a short space of time and may be close to exhausting the immediate downside: The market psychology is now very bearish; there are probably very few people currently long, and significantly the market has hit two key ‘Fibonacci’ correction levels in the past 24 hours. – The chart below highlights these major levels; 38% of the entire rally from the 2008 low, and a 62% correction of the rally from the 2010 low.

Buying AUDUSD now to go long would be a move only for the very brave, of which I do not count myself amongst. However shorts may wish to consider paring back on their position or taking profits around these levels, and those with a desire for a speculative longs may wish to see how the market fares around these levels over the next week or two. On the other hand, a clear and sustained break, on good volume, below these fibo levels, would suggest that I am wrong and that further downside lies ahead.

Wednesday, 6 February 2013

Is the AUDUSD in the early stages of turning?


One of the questions asked many times over the past couple of years is whether the AUDUSD spot is due to turn down? Many people have put money on the table on this particular trade over the past couple of years, and many have lost that money. However, I sense there are some signs that the AUDUSD may be starting to turn. Below I present a series of charts highlighting my thoughts on this particular currency pair. 

The first chart is the Long-Term chart: – The key feature here is what appears to be a potential reversal‘Descending Triangle’ pattern, bounded by the Blue lines on this chart.  – This pattern is a long-way from any sort of verification, however we may be close to rejecting the attempt at the upper resistance line on this chart, and any clear failure up at these levels may be the precursor for a push towards the low of the pattern in coming months, which sits around the mid-95s. Below the chart is an example of a reversal 'Descending Triangle' pattern.
The second chart is the Weekly chart: – The main feature of this is the extended sideways consolidation of the past 6 months. The past month has seen a rejection of the upper part of this consolidation, and appears to be heading back down towards the low of this range at 101.50. - Within the context of the longer-term chart above, this is not a major move; however any sustained break below 101.50 could be the catalyst for a deeper decline, with the low of the potential 'Descending Triangle' pattern as a possible target.
One of the arguments against the AUDUSD fx rate moving lower is the relatively steady yield gap, which in the current environment would seem to suggest little room for a significant move. The  charts below highlight the recent relationship between the AUD and USD yields over the past few months compared to the AUDUSD spot rate: There has been a close visible correlation between the yield spread and spot FX rate. It would seem based on this that a significant move lower on the AUDUSD would be unlikely.


However, correlations can be misleading; they are only useful as an indicator up to a point, eventually they adjust or break-down. – The next chart below shows the 2 year yield spread versus the AUDUSD spot rate over the past 6 years.  The yield spread has contracted by around 200 basis points over the past two years, with very little change in the general level of the FX rate, perhaps this FX rate could move lower without the general yield spread moving. If this were to happen, this may simply be the FX restoring the prior relationship between the two, or to put it more simple, perhap sthe FX rate will now play catch-up.  
The final chart shows the daily AUDUSD chart. -What is interesting about the move today, is how it has broken the trend of rising reaction lows which has been occurring since early October. This could e a significant ‘Tipping-Point’ if the move is confirmed in the next couple of days .

Finally, there are a number of forces at play in markets at present, with a number of countries actively or encouraging a weakening in the currency. There are no signs at this stage that Australia is part of this movement, however it would be interesting were there to be some move by Australia on this front, particularly with the recent announcements of the Australian election for September this year, and the focus on growth as a priority ahead of restoring the budget back to surplus.

Technical Analysis Note: One of the risks with Technical Analysis is the high degree of subjectivity involved, and the adding of the lines on the Monthly chart is an example which makes the pattern seems apparent. At this stage the pattern in the monthly chart is a long-way from being completed, and could easily dissolve away during the next few weeks and months. Nonetheless from a trading perspective it does highlight possibilities, and long-term investors may see this as offering a good risk/reward possibility.

About the author:

STEVEN GOLDSTEIN is a qualified executive coach and performance coach who works with traders and portfolio managers at some of the world’s leading hedge funds and investment banks. He also provides technical analysis research on a number of major cross currencies for 3CAnalysis. Prior to that Steven had a 25 year career as a trader working at Credit Suisse, Commerzbank and American Express Bank in London in the FX and Fixed Income markets, where he used technical analysis extensively as a trading tool. Steven is also member of the Behavioural Finance Working Group at Cass Business school, has written articles and presented on the subject of Behavioural Finance, and is a lecturer on the Society of Technical Analysts diploma programme. - Please feel free to contact him on sgoldstein@bgtedge.com or visit his website at www.bgtedge.com.

Wednesday, 9 May 2012

AUSUSD WEAKNESS and RISK OFF GROWS.

With last week's move continuing this week, the call of the past few weeks for further upside is definitely looking wrong.

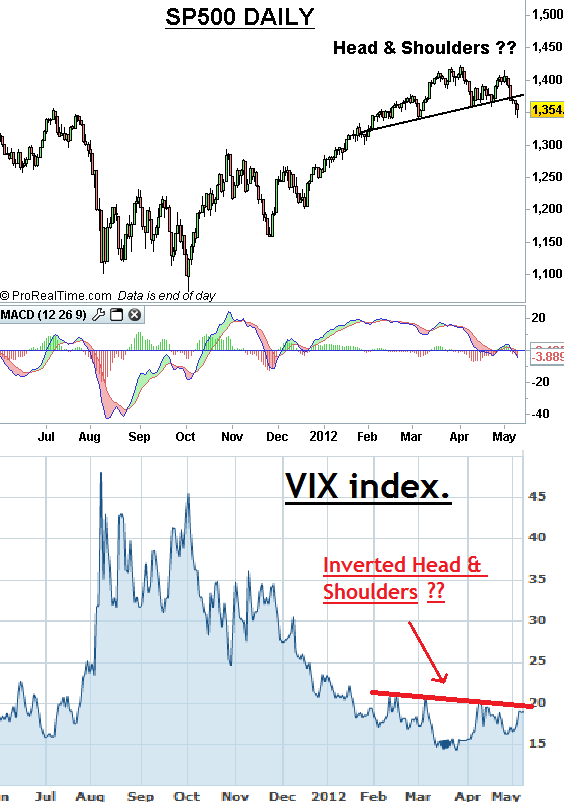
Some charts which highlight the turn towards the Risk-Off and some key points. - Followed by interesting price action on the SP500 and VIX.

First however last week's Aussie PMI was very nasty, the chart below shows this and the AUDUSD, and with risk-off gathering pace, including gold breaking a serious trendline(See below) the prospects for the AUDUSD look decidedly gloomy. 

Also interesting action on the Daily SP500: - A 'Head & Shoulders Top' pattern on the SP500 daily, with an inverted Head & Shoulders on the VIX highlighting the risk of a sharp move growing.


Wednesday, 7 March 2012

AUDUSD - Some strong Bearish signals.


The daily AUDUSD chart (See below) has a number of bearish signals, indicating that the move of the past few days has some legs.


Double Top reversal pattern. - Price action over the past month has seen a broad 'Double-top' pattern.
Bearish 'Three Black-Crows' - Formed over the past three days.
Failure to overcome prior resistance - Price has struggled to overcome resistance from the early Sep and late October peaks.
High volume failure and reversal -29 Feb 2012 - This was discussed last week (Can be seen here).

Resistance for now will be the base of the double bottom pattern @ 1.0605, and beyond that up to the mid 1.06 area. - However the likelihood is that pressure remains to the downside. - There is a cluster of targets on the downside in a broad 1.0360/1.0400 range. Failure here could see a dip to 1.0100/1.0200 area, though currently my preference would be for mid 1.03s to hold.

Bigger picture has been quite constructive for the AUDUSD. -  I would suggest that any dips may provide longer-term traders with decent buying opportunities for further gains beyond February highs eventually if it can hold this dip and find support either around mid 1.03s or 1.01/1.02.

Wednesday, 29 February 2012

Possible Red-Letter Day on AUDUSD and DXY and USDJPY

Just yesterday I highlighted the possibility of AUDUSD making a Bullish Flag breakout. - Today it did break out the top of this pattern, it also made a new high for this move, but it also may have had a spectacular failure in doing so, as highlighted by poor volume on the breakout and heavy volume on the failure. - Today's price action has also produced a bearish 'Shooting Star' candle. - On its own, not that significant, but given the breakout failure and the high volume, this may turn out to be a significant day for the AUDUSD in relation to the next few weeks. The first and second chart below highlight these points.

Below the AUD charts I have some other charts of interest. The first is today's USD Index, which has not yet closed, but it looks nailed on for a significant 'Bullish Engulfing Day', this is often a strong reversal candle signal. I would also like to point out this 'may' also be forming a 'Bullish Falling Wedge' pattern on the USD Index; if this were to complete, then the odds would be strong for a move back to the highs of the USD Index in coming weeks, and quite possibly higher. With the major constituent for the USD Index being the relationship to the EURO and European currencies, this could be significant for the EURUSD.

The fourth chart shows how today's strong up-move in USDJPY has produced a strong monthly candle. This suggests that today's move is based on USD strength at this stage rather than a risk-off flight. I touched on the possibility of a significant move for USDJPY a couple of weeks ago, that post can be seen here . Today's close near the high of the month is supportive of further upside in coming months and in the big picture seems very bullish.  Finally below this chart is some analysis courtesy of Barclays FX research, which also shows some interesting analysis on the USDJPY.

AUDUSD CME FX FUTURES CHARTS

USD INDEX CHARTS
USDJPY FX SPOT CHARTS 


AlphaMind podcast #107 A US Navy Seal Commander, A Mindfulness Expert, and Self-Compassion

In the brutal world of trading and markets, we can often turn in on ourselves, and end up becoming our biggest problem. The ability to stay ...