Showing posts with label Gold. Show all posts

Wednesday, 9 May 2012

AUSUSD WEAKNESS and RISK OFF GROWS.

With last week's move continuing this week, the call of the past few weeks for further upside is definitely looking wrong.

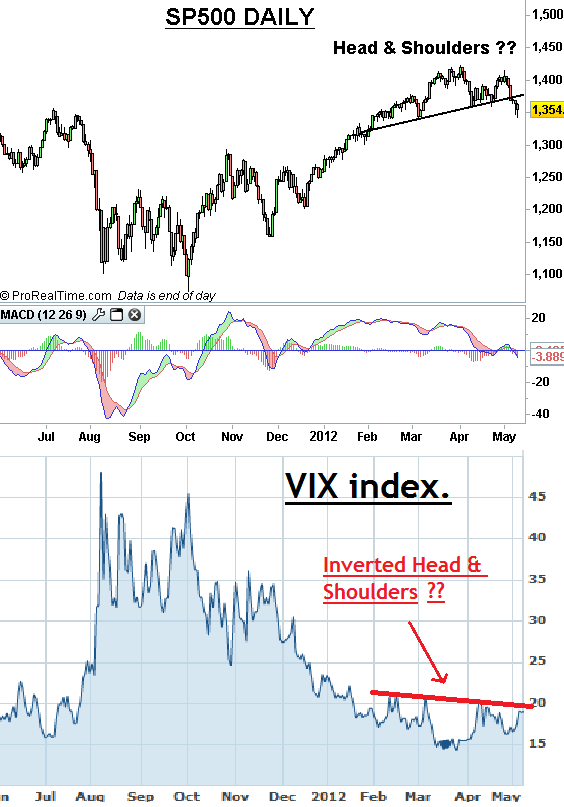
Some charts which highlight the turn towards the Risk-Off and some key points. - Followed by interesting price action on the SP500 and VIX.

First however last week's Aussie PMI was very nasty, the chart below shows this and the AUDUSD, and with risk-off gathering pace, including gold breaking a serious trendline(See below) the prospects for the AUDUSD look decidedly gloomy. 

Also interesting action on the Daily SP500: - A 'Head & Shoulders Top' pattern on the SP500 daily, with an inverted Head & Shoulders on the VIX highlighting the risk of a sharp move growing.


Wednesday, 18 May 2011

S&P Key Pivotal area.

Some of my recent postings have warned of downside on the S+P500 and risky assets, and I have played the market from the short side over the past couple of weeks. However, despite a move to lower levels, this generally has the feel of treading water a little whilst it still makes up its mind.

The chart below is more of an observation, rather than a clear pointer to direction at this stage.

It shows Daily S+P500: The pattern formed over the period through Feb-Apr was an continuation Head +Shoulders pattern. These can be very dynamic patterns when they break-out ( I have included a couple of examples below of this from Weekly Gold and Weekly T-note futures). The S+P breakout however has stalled and has been on an extended re-test of the breakout. In the past few days this has made a minor push below the neckline, a rapid rebound could still save it, however should it continue to sink, then this will be a clear failed pattern, and it is my experience often failed patterns can come back to fully re-test the extreme of the pattern, in this case around 1240/50. - Thus it seems that the next few days may be crucial for the S+P for both the bull and the bear case. - There is one other option, the boring option; whereby it just continues to meander sideways....

Examples of some successful Continuation Head & Shoulder patterns:
1) T- Note Future 2009/2010

2) Gold 2008/2010

Thursday, 1 July 2010

US Equities Fractal - revisitied - again... + EURUSD and Gold update

I keep on harping on about this equities Fractal pattern I spotted a couple of weeks ago. I first alluded to it almost as an aside at the foot of this post here on the 22nd June, admittedly I was a touch sceptical about it, however I deemed to keep half an eye on it. - After a few days it seemed as though it may have some value, and did a more in-depth piece on it here on the 25th June.
Now with the first part of this pattern's predictions, a drop to 1040, a brief consolidation (very brief infact), then a further drop though 1040 and so on achieved, I thought I would revisit this fractal pattern, to see where it forecasts the S+P next.

The fractal pattern is shown below from shortest period a few weeks (Chart #1) at the top, to the multi-month chart (Chart#2) in the middle, to the multi-year chart (Chart #3) bottom.

I have attempted to show how similar the construction of these patterns are. Also note that the top chart is the right-hand side of the middle chart's Head & Shoulders pattern, and the middle chart is the right-hand side of the lower chart's Head & Shoulders pattern.

Given how similar the charts are and how related they are, it is possible they have predictive ability to each higher scale chart. If they do, then one can assume that further lows lay ahead, with a steady continuous drop in the index down to the lows at the start of the second chart. For the S&P this is around 666, (Although I think a case could be made for the support being around 770 as this is where the left shoulder of the neckline occurs), with the likely timing in Q4 for the low. After that, another rally may ensue, which may retrace a large part of this current decline. I base this on the fact that the top and middle fractal retraced twice from the neckline, before breaking on a third attempt. --- This guesstimate of future price action is of course highly speculative, and I consider it more as a rough road map rather than an accurate close-up set of predictions. However, I will continue to pay attentions to the prospective signals up until they stop working .

A couple of other points, the EURUSD has broken well above the 40 day moving average, and appears to have broken the neckline of an 'Inverse Head & Shoulder' pattern. If it can maintain these breaks, then the mid to low 1.2400 area will switch to support, with the 1.30/1.31 as a prospective target.

Gold too has made a dramatic break, I alluded to the risk of this in my post from here a couple of days back. If it can hold this break, this could signal the end of the Gold Bull run for some time, with significant lows ahead. - With regard to Gold and the EURUSD, 1 day's price action does not make or break a trend, however if these break can hold for a few days and in the case of Gold a few weeks, then today's moves could prove to be highly significant.


Monday, 28 June 2010

GOLD at a key juncture possibly.

Of all the Markets which have confused me during my time as a trader, the one which has baffled me the most and has probably floored me more than any other is Gold................ I don't profess to be an expert on Gold, infact a quick look back at the few Gold trades I have done over the years will confirm just that.... However, I do look at Gold and start to wonder exactly how high it can go, given its quite amazing gains over the past decade, particularly in light of the performance of most other asset markets during this time and considering the deflationary winds blowing across the major western economies. I am not however going to try and debate reasons for and against buying or selling Gold, this is covered in depth in a million or so blogs and news services elsewhere, however I am going to post a few charts, which I hope may shed some light on where I think Gold may be heading...

Firstly I will show 2 sets of fractal patterns, one with Bearish possibilities and the other with a potential Bullish outcome:-

The first set of chart show a series of Rising Wedges embedded within each-other, rising wedges are potentially bearish patterns.

The second set of charts show the Gold over the same period, however this time I have identified each pattern as a series of Bullish 'Cup & Handle' patterns.


The third set of charts shows the performance of Crude Oil 2007 and 2008, together with a similar set-up on the weekly Gold chart. I will admit, that if one looks closely at the two charts, there are many differences, however I am trying to capture the essence of the moves, which on both charts show two converging arcs of support and resistance.
My head says the arc converging from the left should win, and turn Gold sharply lower, however there is no reason why this could not break in favour of the sharply rising arc, particularly as this arc has a longer duration. If this were to break to the upside, it could quite possibly project Gold sharply higher. Either way, I think soon we will see a sharp move.

I will confess, at this stage I have no idea which side will win, however I think it worth watching a break of either 1200 and 1300 for the next significant move....

Tuesday, 8 June 2010

Spain v Germany - Evening Star pattern on Hourly


Something to keep an eye on. The deterioration in Euro sovereign debt over the past week has been a stronger driver of the risk-off trade of the past few days, with the main focus being the spread between Germany and Spain. However the above hourly chart shows an evening star pattern formed during the past few hours. It is a signal suggesting the first sign a possible pause/correction in this uptrend, and should be watched for any follow through. Note, at this stage the trend remains higher, however a close through the rising trendline, and a lower close than yesterday could change this.

I would also like to note that some of the other usual 'Risk-off' signals, have been fairly relaxed during the most recent sell-off. USDJPY has remained fairly stable, Gold & Silver remain 'bid to old boots', and Libors appear very relaxed. I am questioning whether the 'Risk-off' trade may be due for another pause.

AlphaMind podcast #107 A US Navy Seal Commander, A Mindfulness Expert, and Self-Compassion

In the brutal world of trading and markets, we can often turn in on ourselves, and end up becoming our biggest problem. The ability to stay ...